Contents |
Executive Summary
Wikibon analyzed a recent survey of flash users to determine the challenges they are trying to overcome and the specific performance benefits of flash for a variety of workloads. The results show that flash can truly be transformative - improving workload performance by an average of 7.2X and help an enterprise achieve a Rapid Response-time Company (RARC) status, Case Study: The Hunting of the RARC.
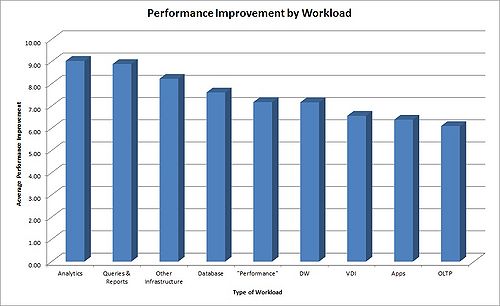
According to users, flash enabled extraordinary improvements in all the workloads in our analysis. Workload complexity and scale were significant factors in determining the magnitude of benefit, with analytic, query, and report workloads showing the strongest gains, in the range of 9X. More complex workloads, such as applications, OLTP, and VDI, also showed excellent performance improvement (6X), but not as dramatic as some others.
This report will assist flash users and those considering flash to gauge the potential benefits of applying this technology to their specific performance problems, to set appropriate expectations, and to determine the relative cost:benefit of the flash technology approach.
Methodology
This analysis is based on a Fusion-io customer requirements/satisfaction survey of 777 flash users from its customer base in mid-2013. Wikibon took the opportunity to explore the range of performance benefits and workloads of such an extensive sample to provide the Wikibon community with useful data about the potential benefits of an important technology.
Wikibon reviewed the complete survey results (including open-ended workload and usage information) and was able to craft a performance benefit taxonomy based on these user responses. Wikibon classified the workloads and usages into the following categories. Their definitions appear in the Appendix below:
- Database,
- Applications,
- Queries and Reports,
- Analytics,
- “Performance”,
- VDI,
- OLTP,
- Data Warehouse,
- Other Infrastructure.
The performance improvement metric was a specific question in the survey itself. The methodology we used for this metric is described in the Appendix below.
We included 384 respondents who provided sufficient workload or usage data and a performance improvement rating in the final analysis. Of them, 72% were from North America, 88% of respondents were commercial enterprises (with a good mix of very large to small businesses represented) and 12% were from the public sector.
While the results are from the Fusion-io installed base, Wikibon believes that the performance and workload data are applicable to similar flash devices across the market.
Challenges Addressed by Flash Technology
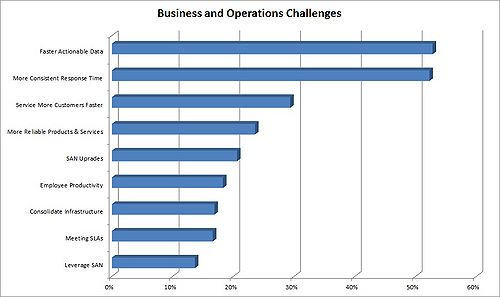
Flash technology was acquired by current users most often to address business challenges and less frequently for infrastructure enablement. Acquiring and using actionable data more rapidly and providing more consistent response times for users were the primary challenges flash users were attacking with this technology. Both of these challenges are business value considerations, i.e., hastening the time to decision and presenting users with a more consistent experience. Other responses – more reliable products and services (especially for service providers), employee productivity and meeting SLAs - also point to the importance of business value considerations to the use of flash.
Challenges that were cost-avoidance related (consolidating infrastructure, upgrading and leveraging SAN) were important to some users, especially those in government and education. Enterprise users – from small to very large – were more interested in meeting SLAs and getting faster actionable data.
Workload-Specific Performance Improvements Realized by Users
The average performance improvement across all the respondents and workloads was 7.2X. The magnitude of the reported improvements were game-changing – especially as they relate to the business challenges users were addressing. Analytics and queries and reports were the workloads showing the most dramatic improvement (~9X) in the sample. Database performance was a little higher than average (7.6X). Workloads involving higher degrees of complexity and other moving parts, i.e. VDI, applications and OLTP, showed major performance improvement when flash was utilized (~6X) but less dramatic than other workloads. Other infrastructure included a few mentions of VM, migration, SAN and other disparate workload types. Clearly, flash can dramatically improve a wide variety of performance challenges.
Obviously, applications and complex workload types are more dependent on multiple factors that impact performance. The relative simplicity/complexity of the workload seems to be the primary governing factor to the extent of improvement that was realized. For instance, within database, MySQL showed the most significant performance improvement (9.7X). MS SQL users reported an 8.1X improvement, while Oracle database users reported a more modest 6.3X improvement in performance. When respondents reported low relative levels of performance improvement, they often cited application code and other factors as the probable source of performance gains in only the 1-2X range.
The findings demonstrate that users of flash technology reported significantly improved performance across a wide variety of workloads. Of course, those considering using flash technology should remember that "your mileage will vary depending…”.
Action Item: A growing number of enterprises are trying to become Rapid Response-time Companies, emphasizing rapid delivery of IT and application services for business advantage. Flash technology can dramatically improve application and system performance (an average of 7.2X) across many workloads. Query, reporting, and analytics are especially promising targets as is general database performance. Of course, “mileage will vary” as a function of the complexity of the use case and the underlying software and database (i.e., query speed-up vs. overall application performance). But the magnitude of the potential improvement gains indicates that users struggling with nearly any type of performance challenge will be well served to explore and deploy flash-based solutions.
Footnotes:
Survey Details
The data in the challenges figure was drawn from the following survey question:
- '"What business or operational challenges did your organization face prior to purchasing Fusion-io technology (select all that apply)
The workload type data was gathered from two open-ended questions:
- "In a few sentences, please describe the performance benefits you have realized with Fusion-io technology."
Wikibon applied the following approach to assigning the open-ended usage and workload responses to the specific categories used in this analysis.
- Database – responses characterizing the use as database – usually specifically MS SQL, Oracle, or MySQL.
- Applications – responses ranged from “application” to named apps such as Exchange, Epicor, and SAP.
- Queries and reports – responses specifically named the target usage as queries or reports.
- Analytics – responses that referred to analytics generally or named SAS or some other analytic tool.
- Performance – responses talked about performance in general terms, including just “IO performance”.
- VDI – Desktop virtualization was a general response, but some respondents mentioned VMware and Citrix offerings specifically.
- OLTP – responses referred to “OLTP” specifically
- Data Warehouse – responses referred to general data warehouse performance, but also included uploading and updating specifically in some cases.
- Other infrastructure – responses in this category included VM performance, migrations, SAN performance, batch, and a handful of others with few mentions.
- Financial – These responses had to do with an estimation of cost savings or value in the opinion of the respondent. Responses here included mentions of consolidation, SAN savings, or cost avoidance in general. We included their data as an illustration of how users gauged the economic advantage of flash technology.
Our performance improvement metric was drawn from a specific question in the survey:
- "How much have you improved your performance with Fusion-io technology?'"
- >10x
- 6-10x
- 3-5x
- 1-2x
- None
- Don’t know
We used the midpoint of each range (i.e. 8 for 6-10X response) and a conservative 13X for the >10X response to calculate the average performance improvement metrics for each workload.


